MARKET ANALYSIS : NIFTY50- SENSEX- STOCK INTRADAY RS PRICE LEVEL PREDICTION

- NIFTY50 Intraday Forecast RS Price Chart (weekly and monthly) for F&O trader.
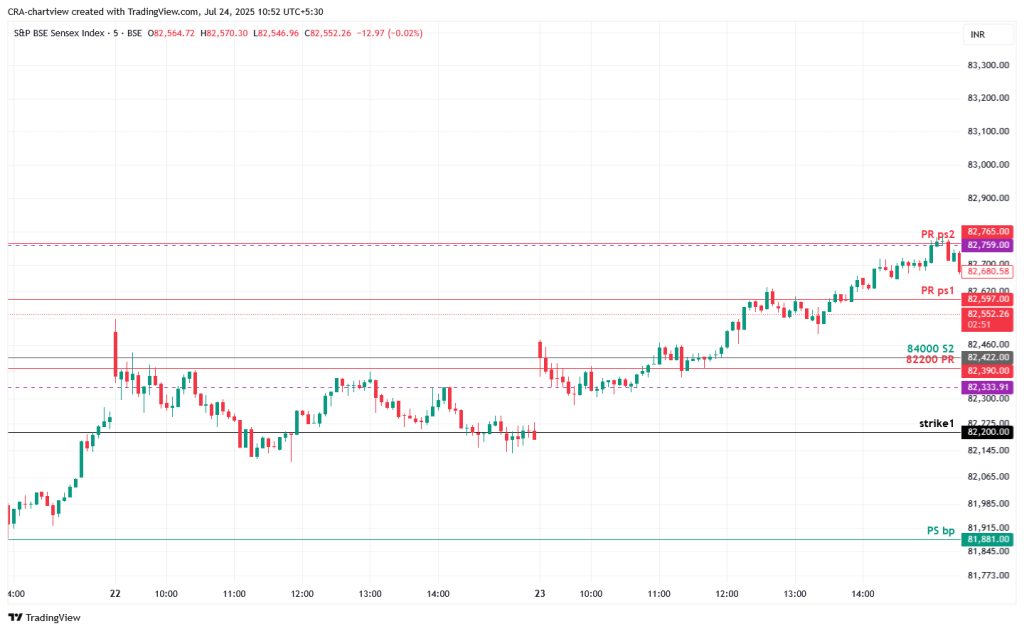
- SENSEX Intraday Forecast RS Price Chart (weekly and monthly) for F&O trader.
- Stock Intraday Forecast RS Price Chart monthly-Order based (RIL, TCS, KOTAKBANK,INFOSYS,AXIS BANK,HDFCBANK or any other F&O stock- coming soon)
POST PURCHASE Updated Reaction Zone Levels available in “Downloads” tab in account page after 23:00 hrs .
Chartview Research and Analytics ![]()

An independent research and analytics firm
- We provide high accuracy forecast resistance and support price levels on indices and stocks for intraday trading
- We apply breakthrough technology based on algorithm and mathematical modelling.
Mission
“Consistently endeavors to connect between future and past price action in near term through mathematical psychology in finance field by quantitative cognitive modelling and proper judgement as near term trend can be forecast.“
CRA
Our Approach
Methodology :
- We observe the Price movement
- We collect/analyze/research/model data
- Develop mathematical cognition by QC modelling
- Analyze and design pattern/price action to decipher the Market psychology

Intra-day trading :
- A subject of risk management.
- A complexity science shaped by uncertainty.
- A process influenced by the psychology of market participants and events
- Technically driven, even when fundamentals diverge

Time and again challenge :
A Consistent achievement ??
Question remains : Whether information about the firm is incorporated in price of scrip or not?
- Chartview forecast model decode Market behavior.
- Information about firms is reflected in the forecast price levels
- A simple and easy to use product
Chartview Reaction Zones: Our Methodology
Chartview RS levels — also called Reaction Zones — are the outcome of years of independent empirical study on market behavior, particularly on instruments like NIFTY, BANKNIFTY, and selected equities.
🔬 How These Zones Are Derived
- We analyze recurring patterns around key daily OHLC data (open, high, low, close)
- We observe price rejection points, time pivots, and swing structure
- We use structured formulas developed through manual research — not AI or ML
- We do not rely on live orderbook data or price manipulation in any form
⚠️ What They Are Not
- Not a buy/sell/hold recommendation
- Not a prediction engine or investment signal
- Not generated from trading positions or influenced by market exposure
Thank you for trusting Chartview.in!
Disclaimer:For educational and informational use only.Not a investment or trading advice.