📘 Refine Market View with DS Structure— Built for Independent Traders
Use your own trading platform to observe daily price charts with option strike–based demand and supply (DS structure –support and resistance) zones. These are derived from short straddle positions and reveal how the market sets intraday expectations.
🔁 The Role of Straddle RS Levels in Price Action
These Straddle demand and supply (RS lines) often act as the cause of price action — not the result. The range between demand and supply lines(support and resistance) for a given strike is called the operating zone. You should mark the top straddle RS zones on your chart.
📊 Why the 1st and 2nd Straddles Matter
On most days, the 1st and 2nd straddle zones dominate price behavior due to their weightage. However, during major gap-ups or gap-downs, caused by short covering, call writing, or put unwinding, new RS zones should be chosen based on the opening strike and nearest dominant strikes.
📈 Price Zone Behavior Explained
If price gets support at a strike’s support line, it tends to travel toward that strike’s resistance — unless interrupted by another strike’s stronger RS zone.
- Strength priority is based on Total Open Interest (OI)
- And dynamic OI build-up during the day
- Entry and exit timing
- Risk–reward understanding
- Decision-making under pressure
- Your overall profit factor
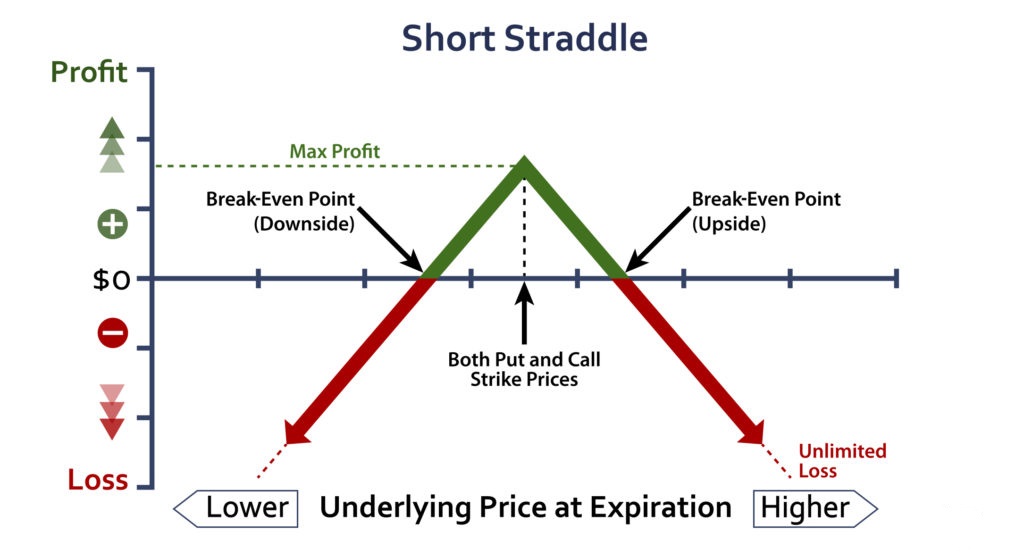
❓ What is a Short Straddle?
A short straddle involves selling both a call and a put at the same strike and expiry — used when the trader expects little movement. While pure straddles are rare due to market complexity, the influence of straddle-based zones remains throughout a weekly/monthly series unless major structural change occurs.
🧠 Breaking the Myth: Writers Always Win?
There’s a belief that writers win 70% and buyers win 30%. But with proper:
- Risk management
- Market dynamics understanding
- Time-sensitive entry and confirmation
…buyers can achieve 80% success rate over time.
🟢 Practical Buying Logic
If put writing dominates a level → look for call buying opportunity. If call writing dominates → look for put buying. These signals work best with RS confirmation + trade discipline.
🧪 How Chartview’s DS Levels Help
Our strike DS levels (resistance and support) are derived through quantitative modeling and behavioral logic. This setup helps you identify the reason behind price movement and supports your trading with an evidence-backed, disciplined process.
⚠️ Disclaimer: This is an educational and informational framework based on price structure and statistical behavior. It is not investment advice. Always apply your own risk management.
⏰ Practical Time Windows for Option Buyers
Identify the most favorable windows to trade with momentum and minimal decay.
| Time Slot | Suitability | Notes |
|---|
✅ Why Believe This System?
Because it’s built entirely on objective, data-driven logic — not tips, opinions, or lagging indicators. This approach is based on options market data and statistical modeling, which reflect the real positioning of put and call writers — the participants who influence daily price movement.
Rather than following patterns, this system is based on the principles that create the patterns. It acts as a leading indicator — helping you anticipate price zones before they play out.
Over time, this process-oriented method removes guesswork and gambling instincts. It trains you to focus on patience, structure, and confirmation, helping you build skill in identifying high-quality entry and exit points — which is the real edge in intraday trading.
📌 How to Day Trade with DS (Demand–Supply) Levels
- Stay informed: Be aware of upcoming events like earnings releases, RBI policy announcements, macroeconomic data, or global cues before the session begins.
- Pre-market prep: Set the 1st, 2nd (if reqd) strike DS levels (derived from short straddle zones) in your charting platform. These are your key behavioral reference points for the day.
- Stay patient at open: Avoid taking trades in the first 30 minutes unless price action aligns clearly with your mapped levels. The open can be volatile and misleading.
- Wait for confirmation: Take trades only at clear DS zones (support/resistance) and after a visible price structure or curvature formation. Sometimes, prior resistance acts as support and vice versa — observe closely.
- Track early market structure: The first hour’s high/low, along with the previous day’s high, low, and close, form important reference zones. These define the day’s psychology and action zones.
- Use RS logic dynamically: If price takes support near the PS (Primary Support), it may attempt to cover the zone to PR (Primary Resistance). If momentum sustains, it may even move toward R2 or break levels — activating a new strike’s zone. Adjust your reference accordingly.
⚠️ Common Mistakes to Avoid in Intraday Trading
- Overtrading without confirmation
- Revenge trading after a loss
- Letting greed delay your exit when already in profit
- Exiting too early due to fear
- Focusing excessively on P&L instead of execution logic
Note: In huge gap-up or gap-down scenarios, the opening strike’s RS levels often override other zones — realigning the active framework for that session or humble request avoid if not confident.

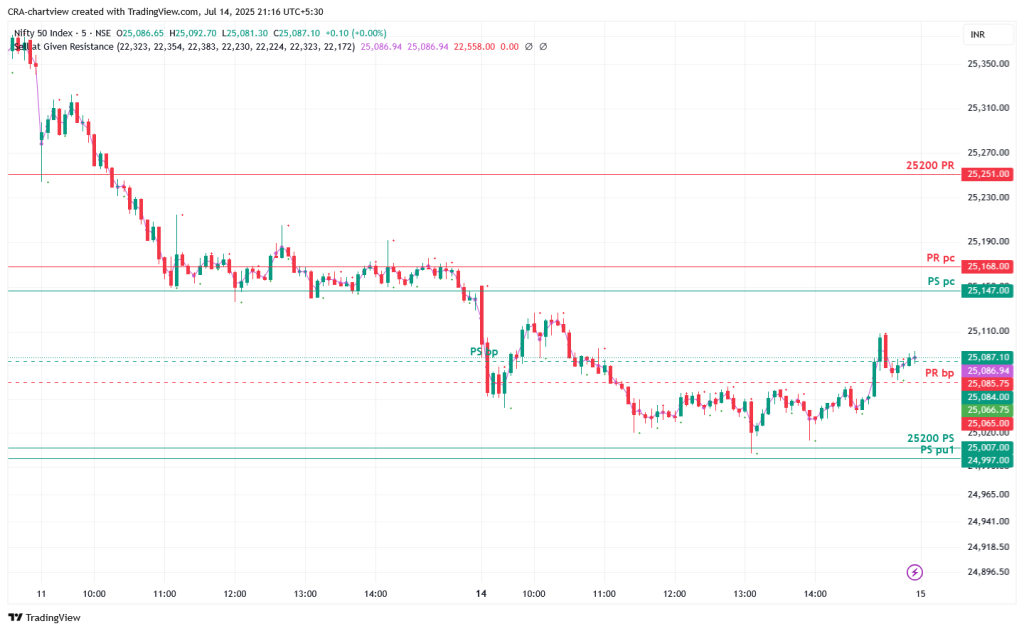
NIFTY 50 OPTION CHAIN ANALYSIS Example
NLVL140725Charting Platform Set up Example ( Nifty50- 5 minute chart)
🧠 Trading Psychology: The Real Key to Consistency
Many skills are important in trading — such as evaluating fundamentals or identifying chart trends — but none are as crucial as mastering your mindset and psychology. Controlling emotions, thinking clearly, and following discipline form the backbone of successful traders.
🔄 Emotions That Affect Traders
There are two primary emotions to recognize and control:
- 😨 Fear – leads to hesitation, early exits, and missed opportunities
- 💰 Greed – causes overtrading, holding too long, or chasing risky setups
- 🌀 Also: Hope, Regret, and FOMO (Fear of Missing Out)
🎯 Trading Acumen & Discipline
Traders need to make fast, focused decisions — often under pressure. This requires:
- Clear presence of mind
- Strict discipline to follow your own trade plan
- The ability to exit based on logic, not emotion
The market does not reward emotion — it rewards process and preparation.
📉 Controlling Emotion-Driven Decisions
Start by identifying your emotional triggers. Ask yourself:
- What do I feel when my position is in a large loss?
- Do I hold on, cut loss, or try to average?
These decisions must be based on fact and planning, not panic. A well-defined risk management plan helps you:
- Pre-define exit points before you enter the trade
- Focus more on where to sell than where to buy
- Avoid the trap of holding losing trades too long
📘 Suggested Learnings for Option Traders
If you trade options, study the Black–Scholes Option Pricing Model (Nobel Prize, 1997) — it helps understand why options naturally decay over time.
Also, consider reading “Thinking, Fast and Slow” by Daniel Kahneman (Nobel Prize, 2002). It explains how human psychology affects decision-making — including in trading and investing.
🔁 Stay Flexible and Reflect Often
The best traders are flexible — they experiment within reason, track their results, and learn from experience. Over time, this builds confidence and reduces emotional interference.
Regular self-assessment is essential. Review not just your profits and losses, but:
- How well you prepared before a trading session
- How up to date you are with market context
- What you learned — and what you could improve
Reminder: Trading is not just a technical skill — it’s a behavioral process. Mastering your psychology can help you stay consistent and rational, especially under pressure.